Popular Stocks Analysis
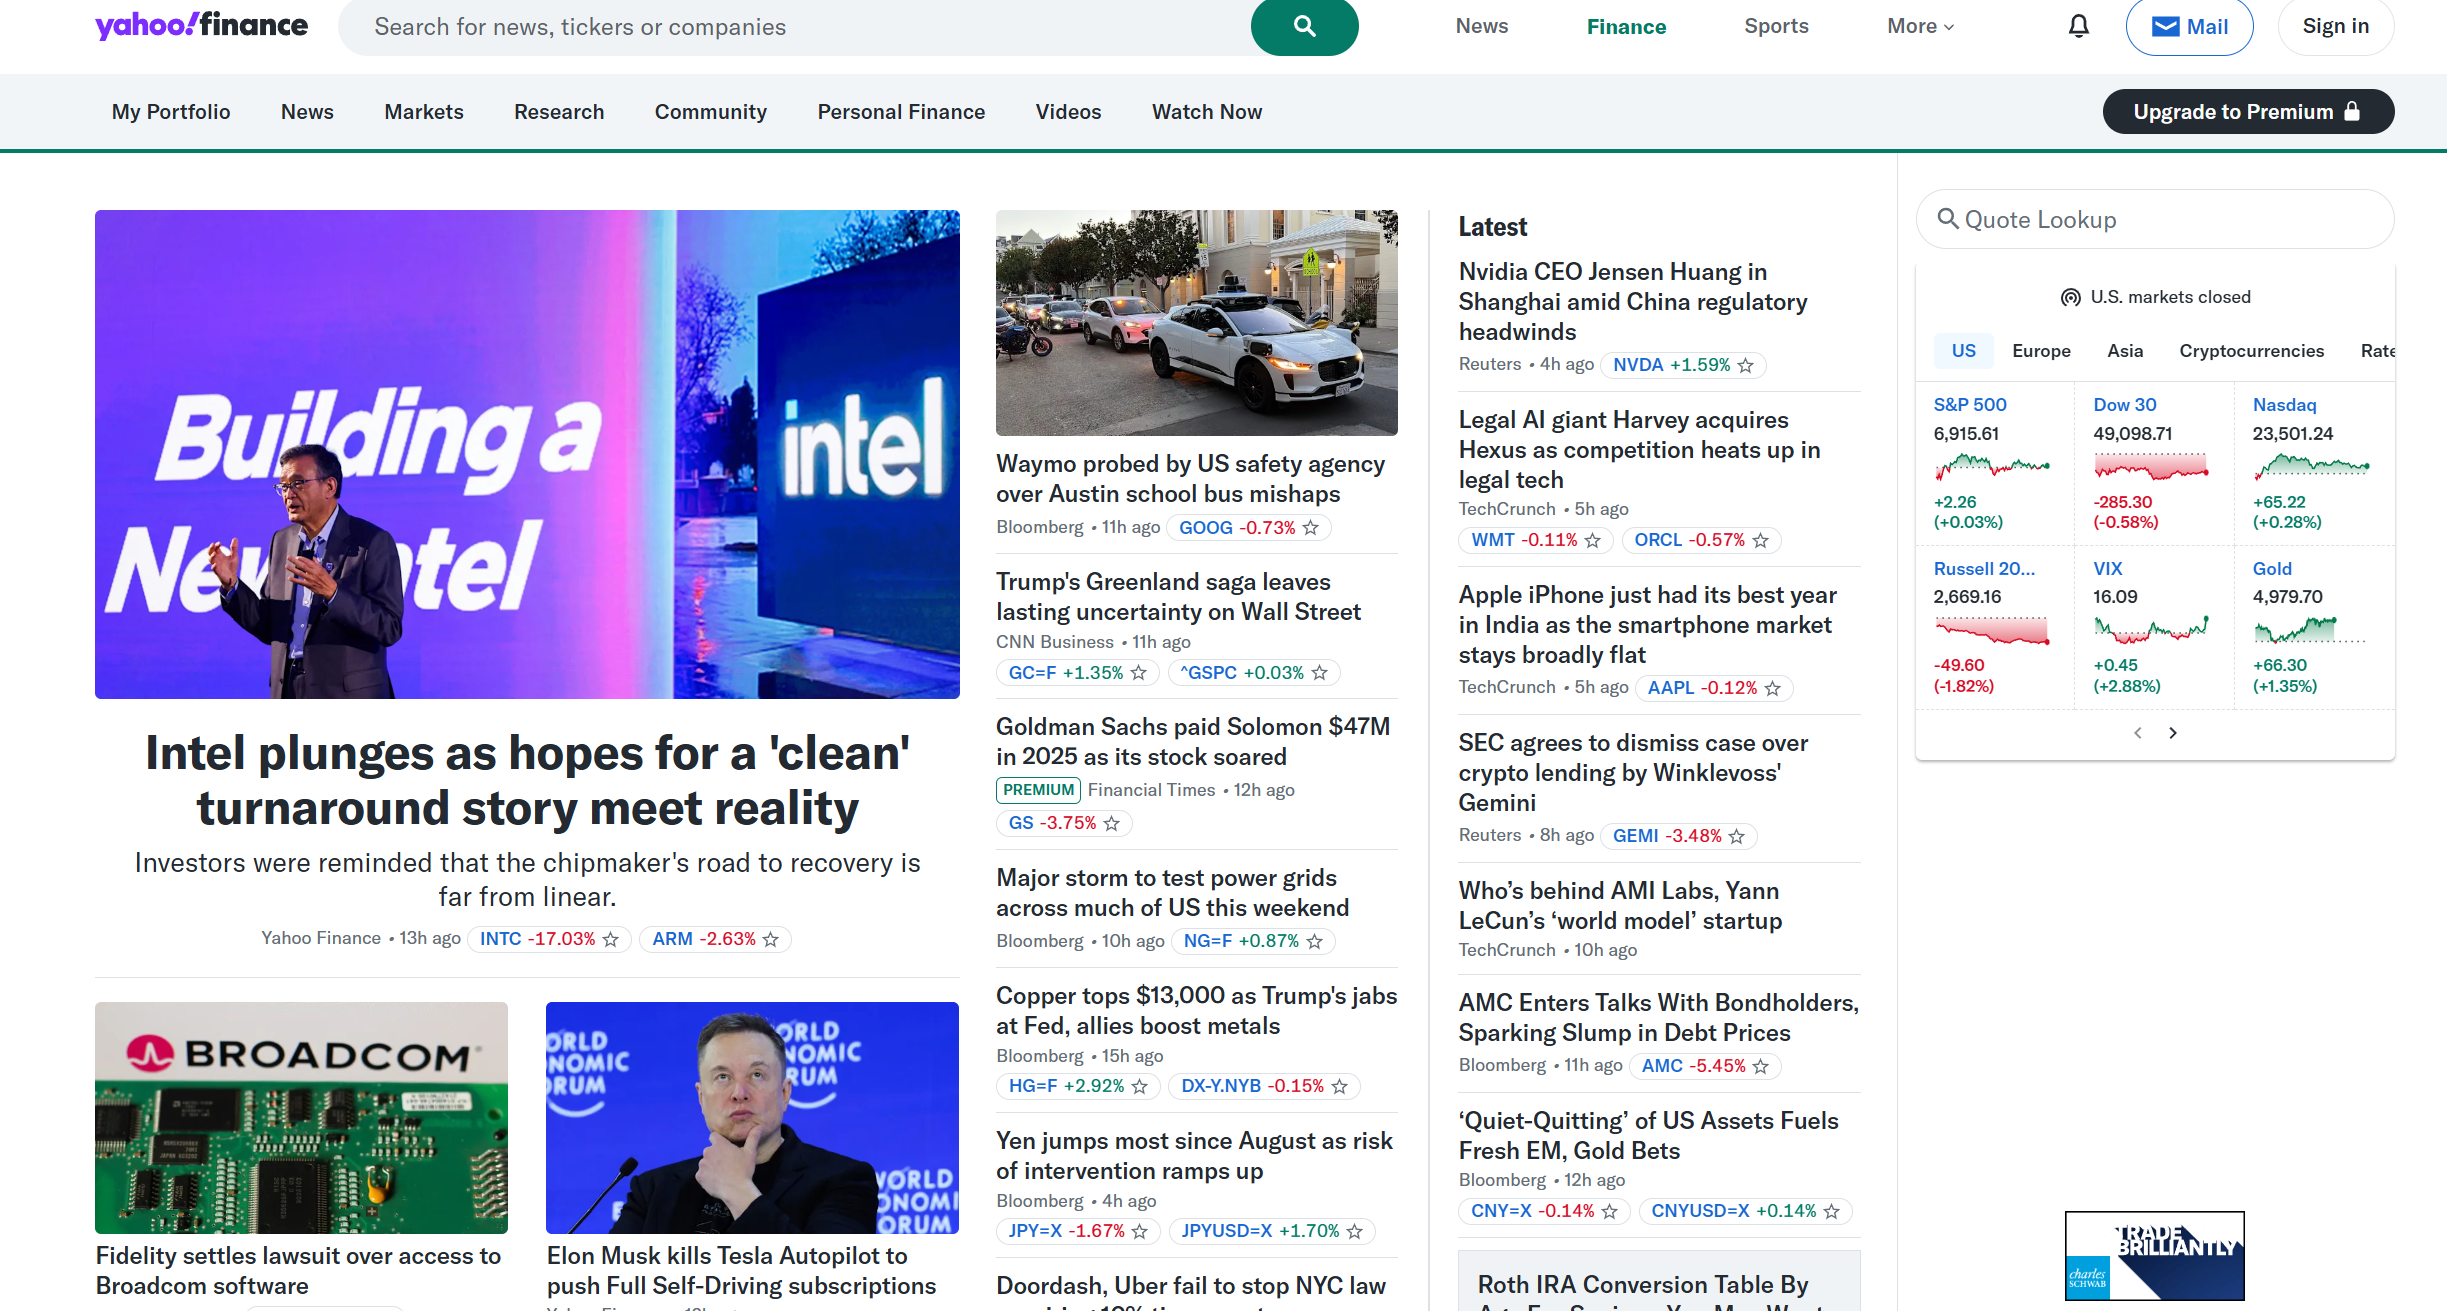
Tesla, Inc. (TSLA)
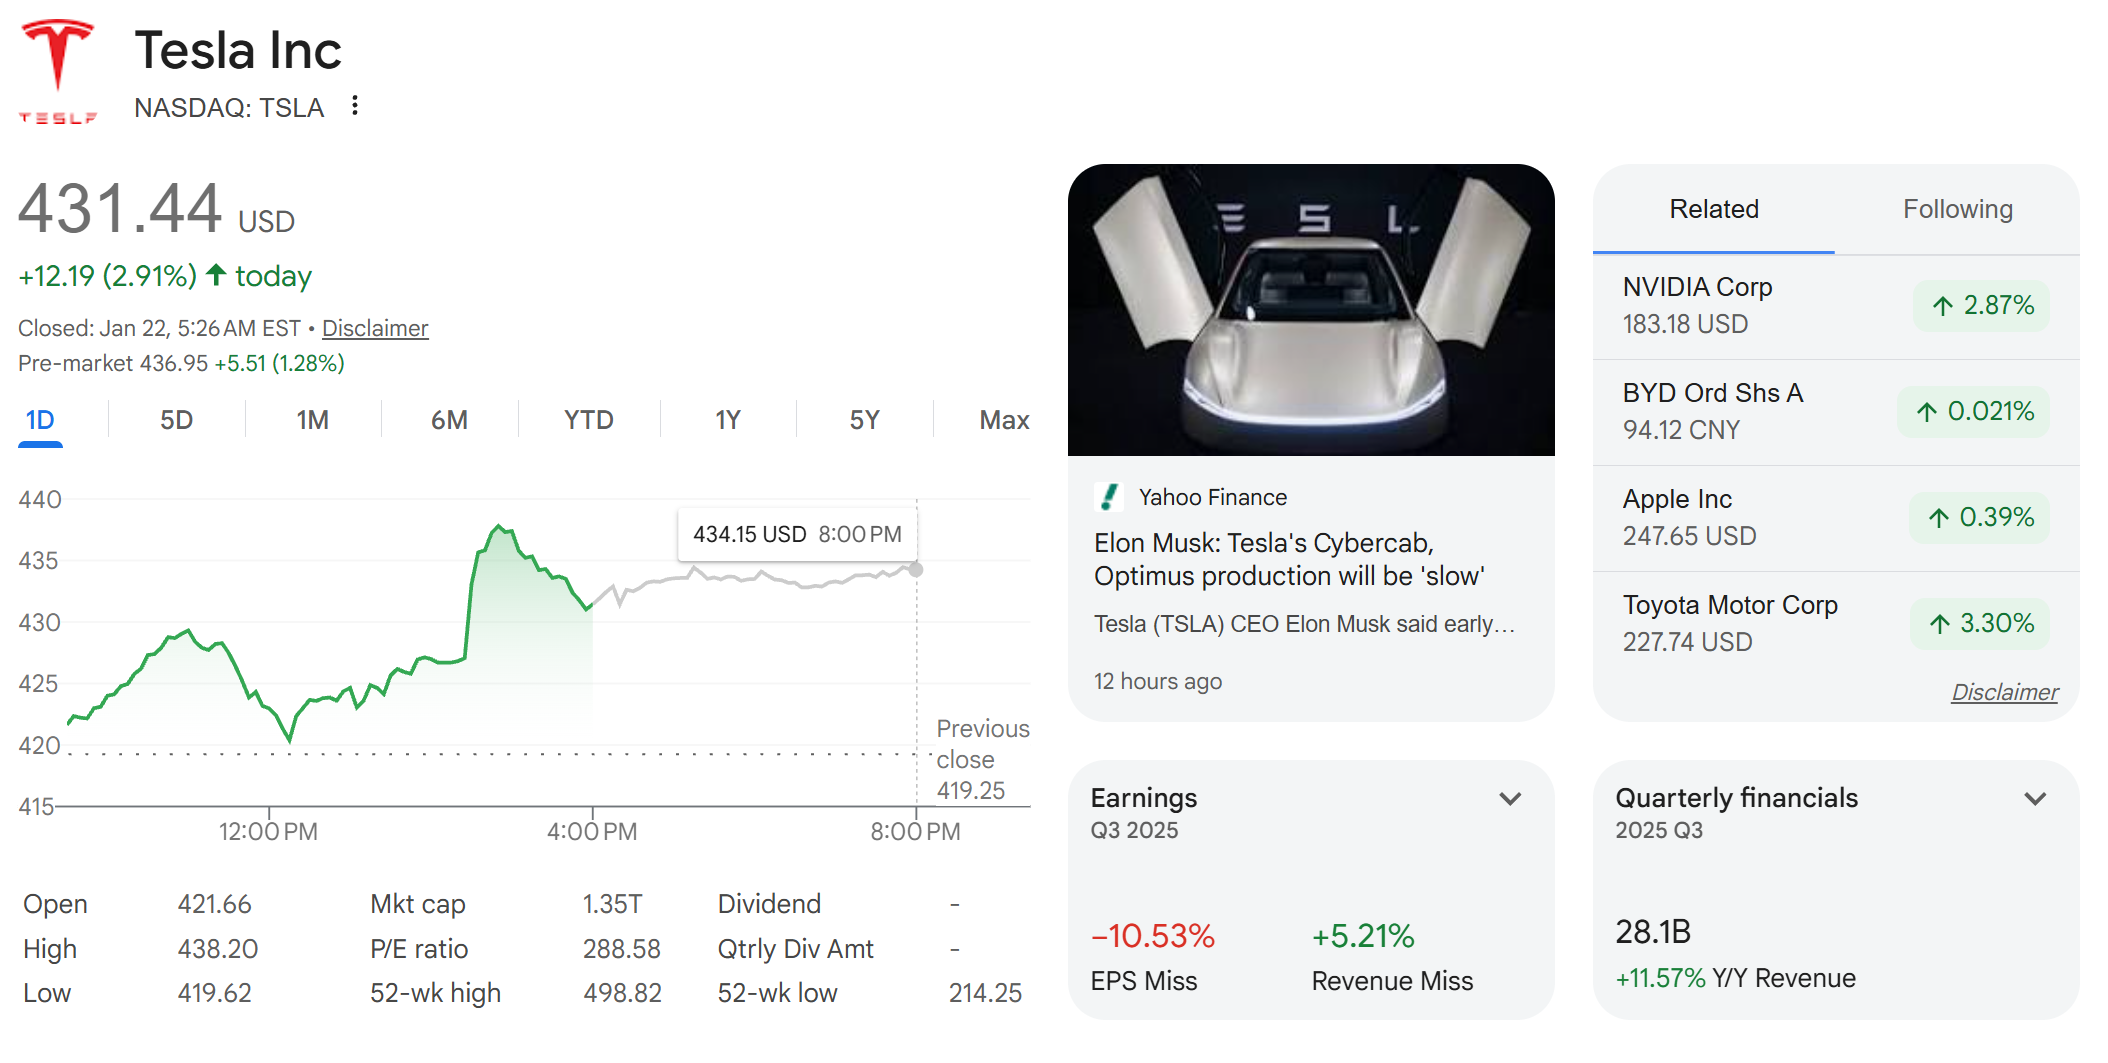
Figure 1: Tesla Stock From Google
Tesla, Inc. (TSLA) is one of the most popular and frequently traded stocks in the technology and automotive markets. As a major company known for electric vehicles, energy solutions, and AI-related technologies, Tesla often attracts strong attention from investors. Many investors follow Tesla's stock price, daily trading activity, and news updates to see how product releases, vehicle sales numbers, and software development affect the company's performance. Because Tesla's stock price can change quickly and is often influenced by public opinion, it is commonly used as an example when studying fast-growing companies and overall market behavior.
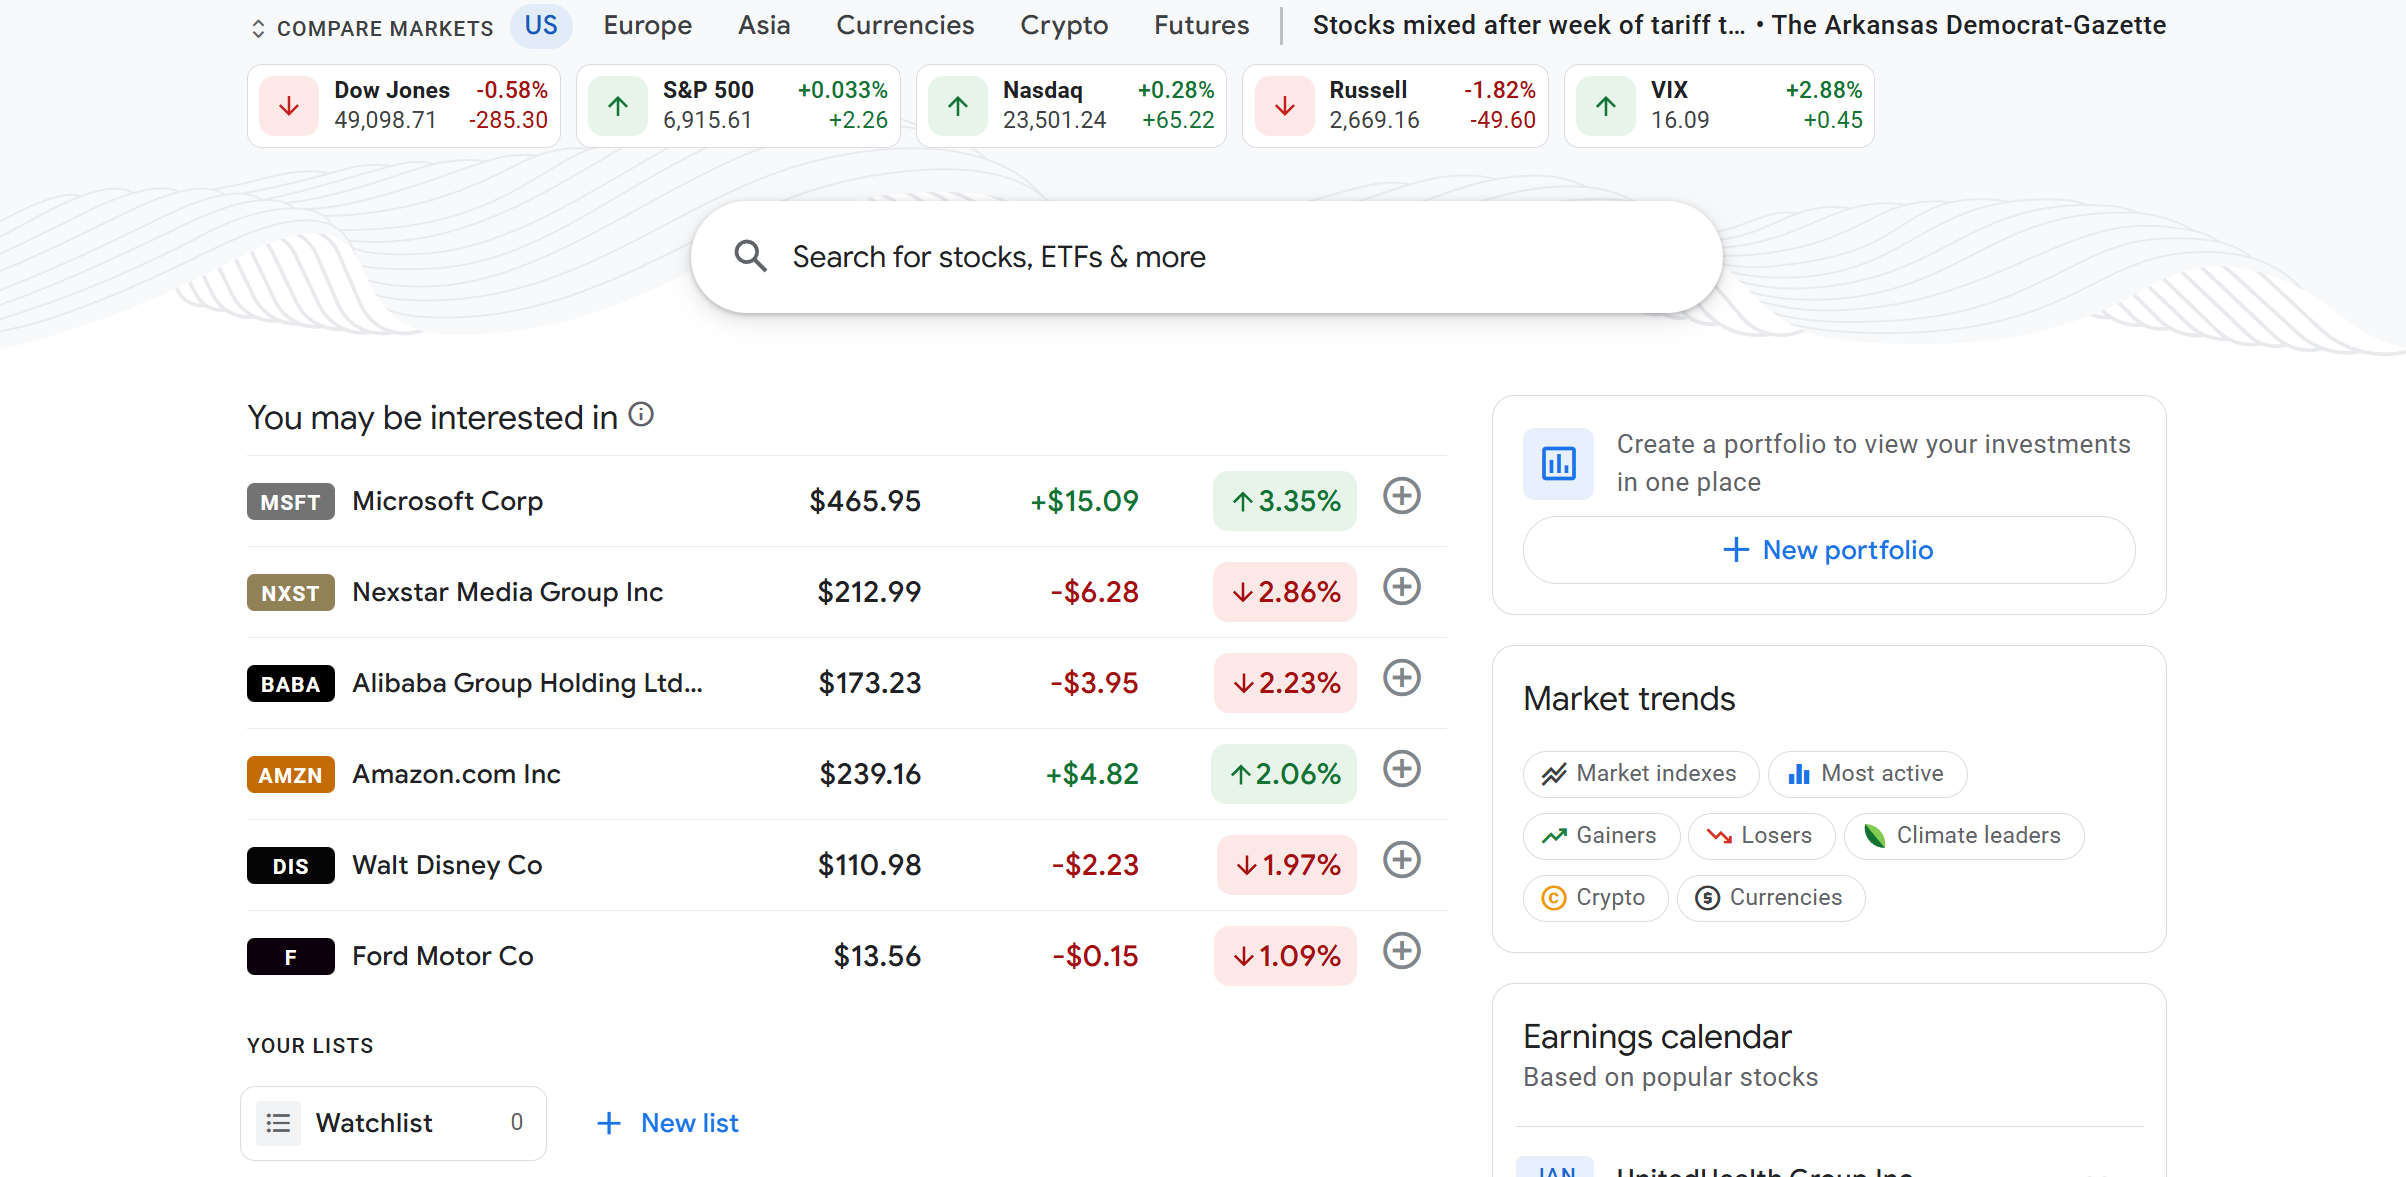
Alphabet Inc. (GOOG)
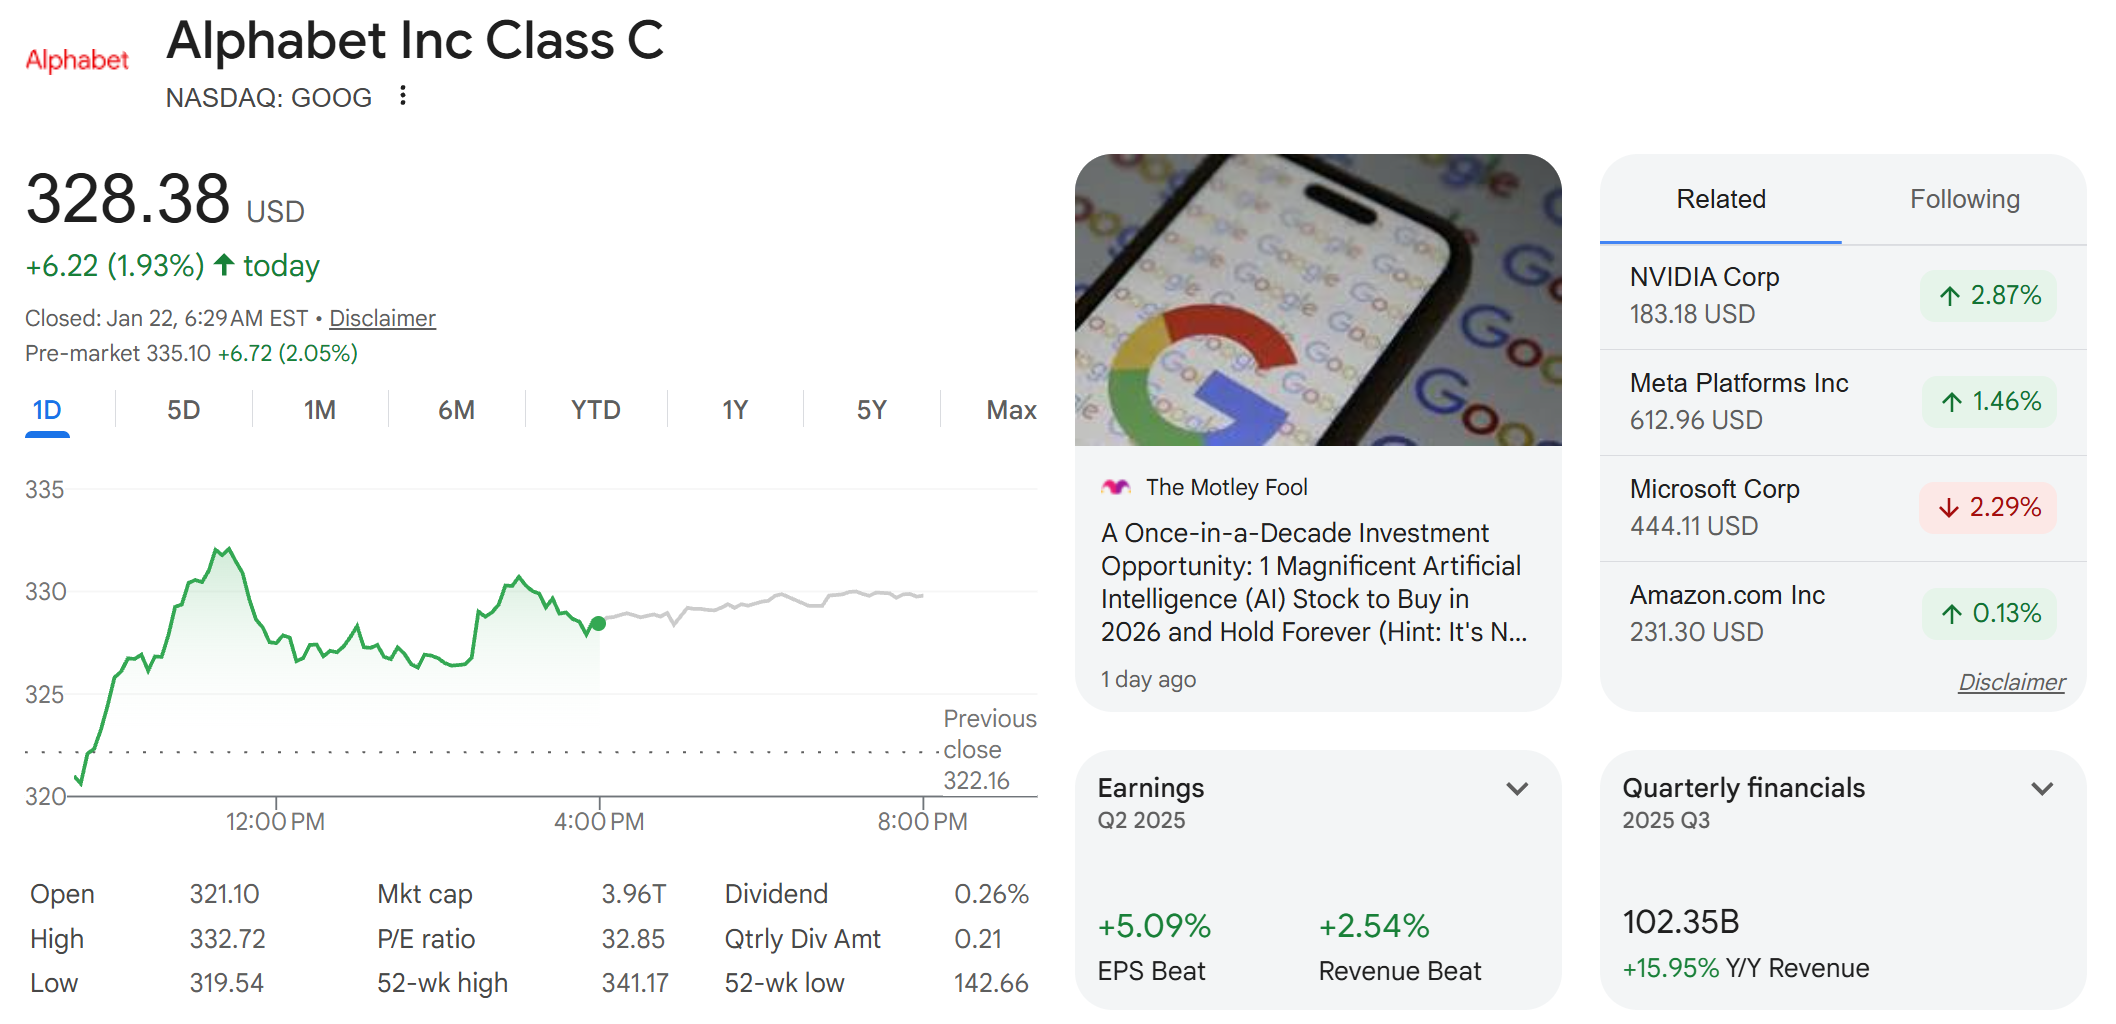
Figure 2: Google Stock From Google
Alphabet Inc. (GOOGL), the parent company of Google, plays a major role in the digital economy through its dominance in online search, advertising, and cloud services. Google's stock performance is closely tied to trends in digital advertising, data-driven technologies, and artificial intelligence development. Many investors analyze Alphabet's stock by reviewing revenue growth, advertising performance, and investments in emerging technologies such as AI and machine learning. Due to its diversified business model and strong position in the global technology sector, Google's stock is often studied to understand long-term innovation-driven growth.
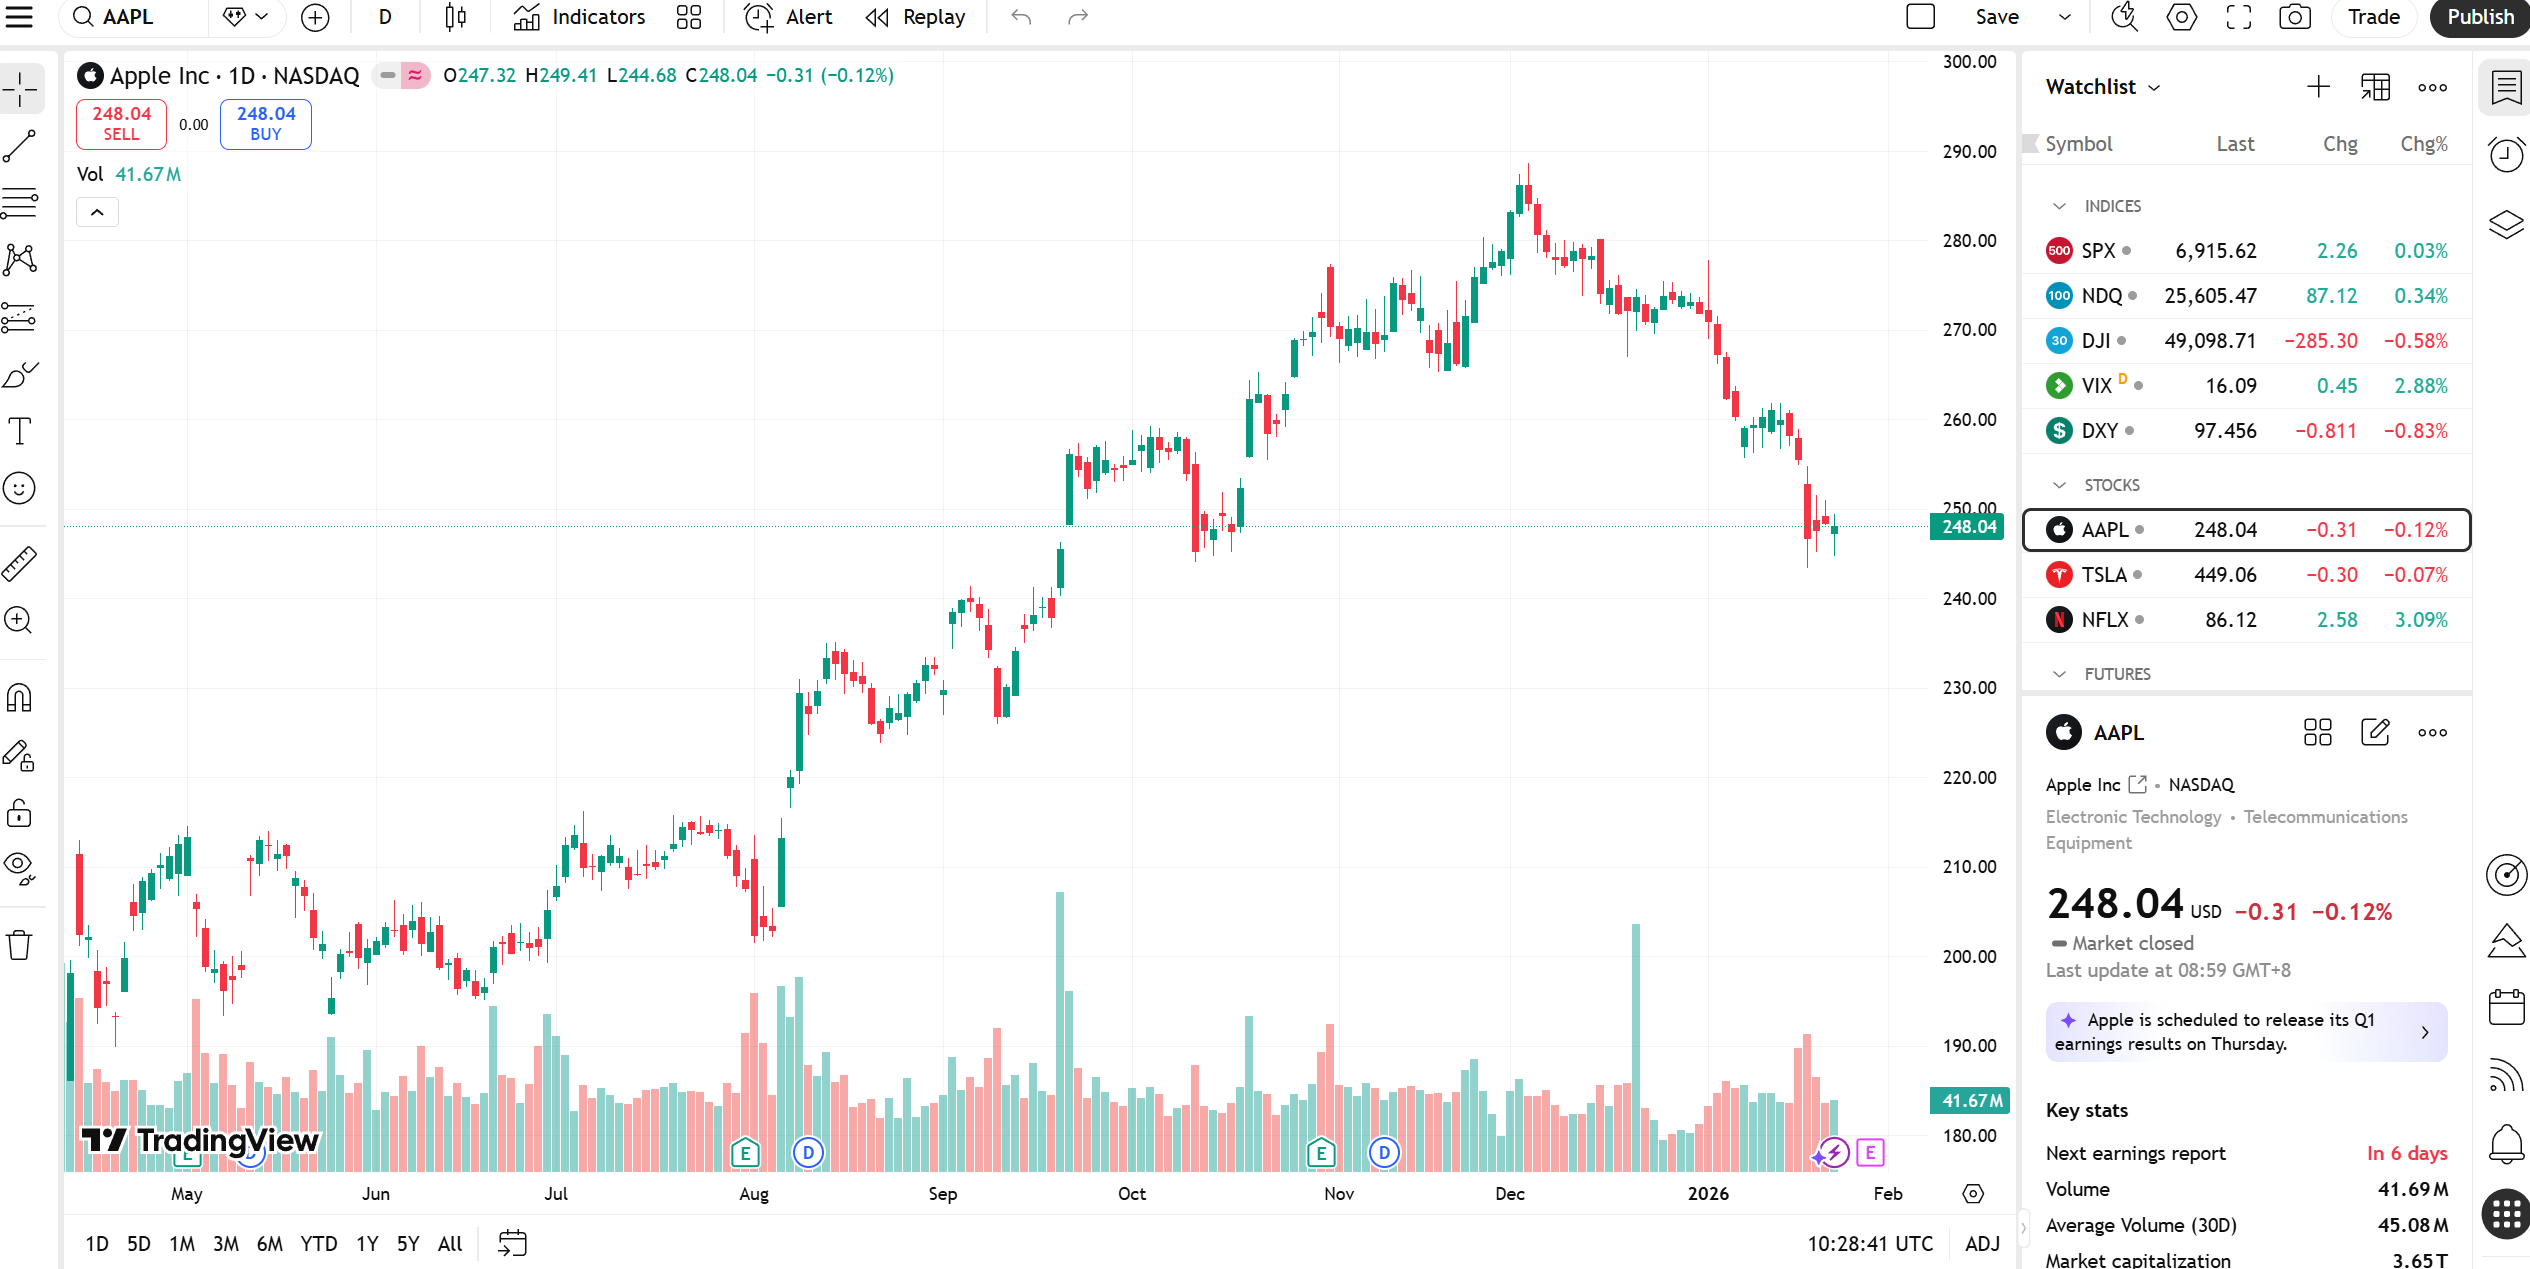
Apple Inc. (AAPL)
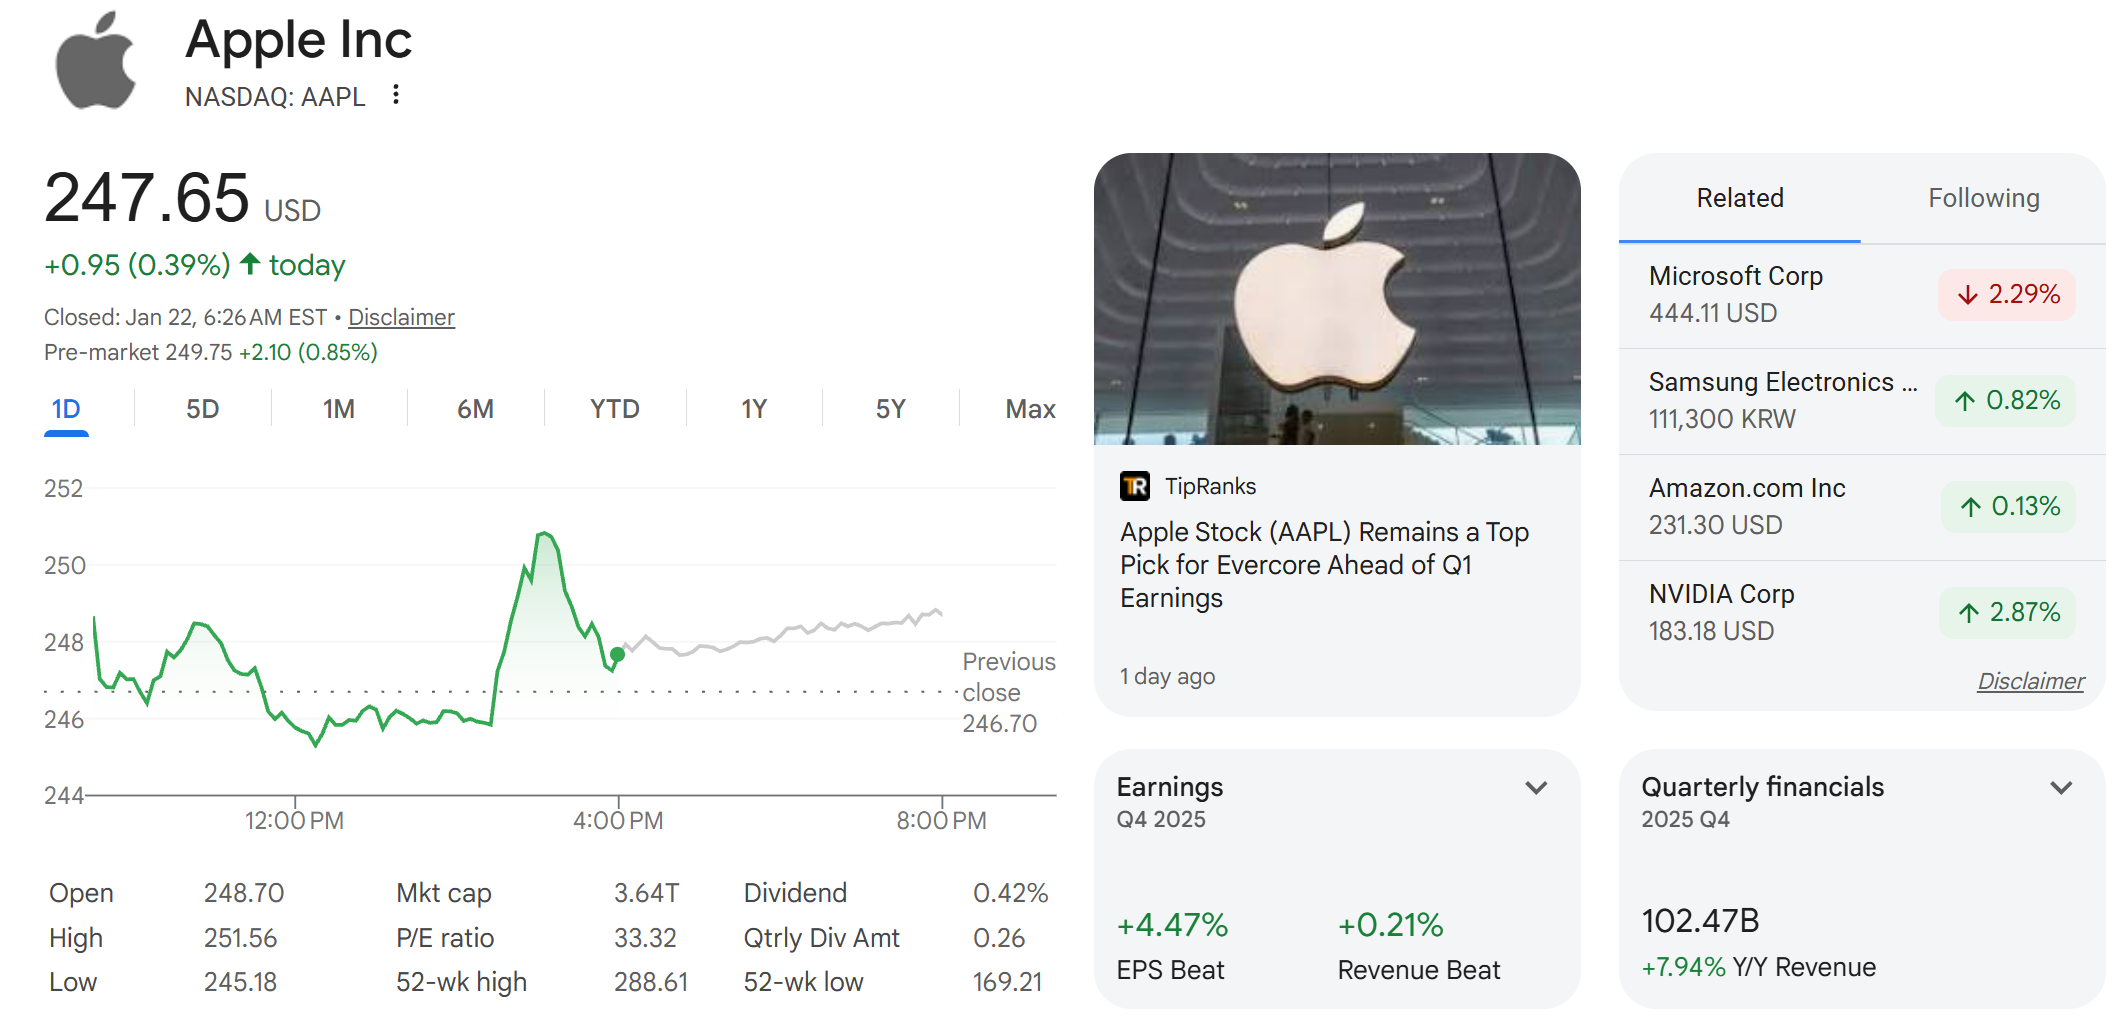
Figure 3: Apple Stock From Google
Apple Inc. (AAPL) is one of the largest and most stable companies in the global technology market. Known for its consumer products such as the iPhone, iPad, and Mac, Apple's stock performance is often seen as a reflection of overall market confidence in large technology firms. Investors commonly track Apple's stock price trends, earnings reports, and product launch events to understand its long-term growth potential. Because of its strong brand recognition, consistent revenue streams, and relatively lower volatility compared to other tech stocks, Apple is frequently used as a benchmark for evaluating market stability and investor sentiment.
Nvidia. Inc. (NVDA)
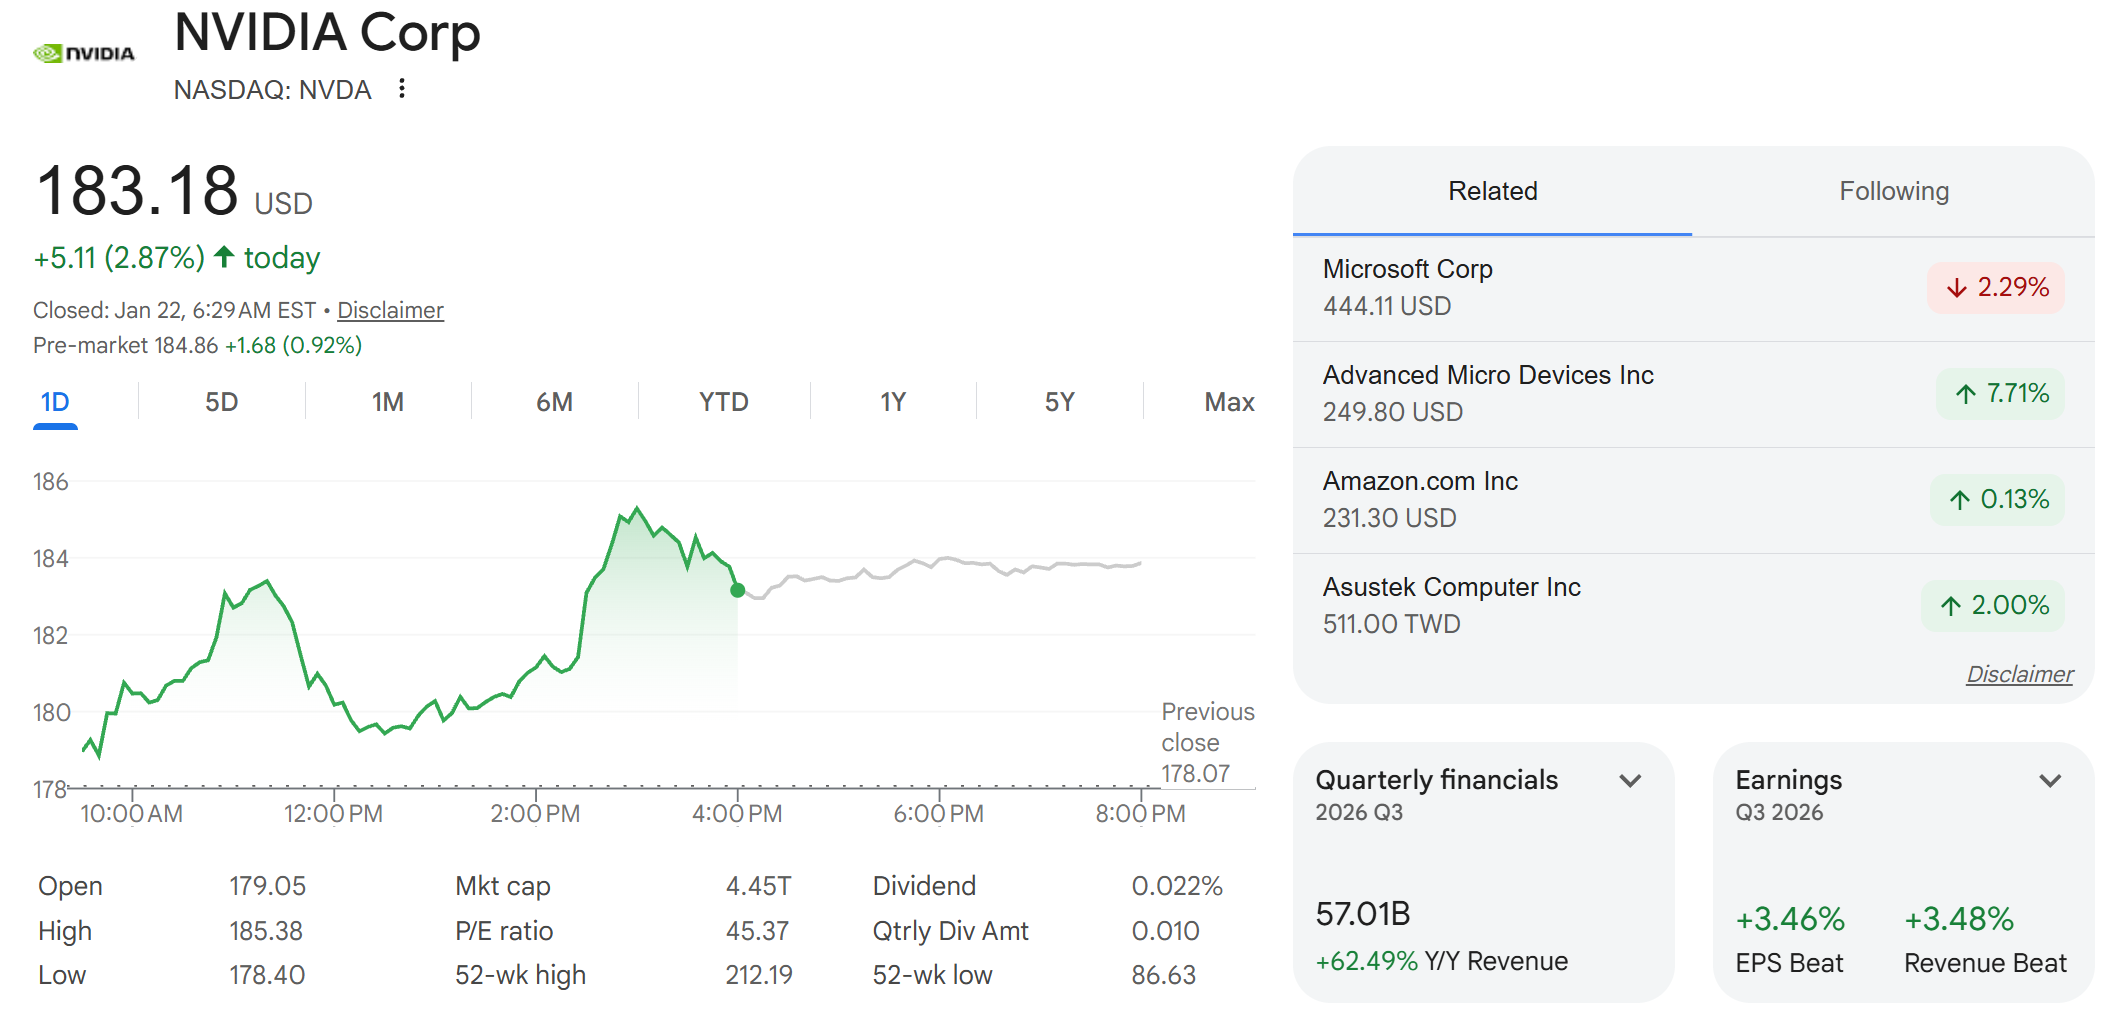
Figure 4: NVIDIA Stock From Google
NVIDIA Corporation (NVDA) is a leading company in graphics processing units (GPUs) and AI computing technologies. In recent years, NVIDIA's stock has gained significant attention due to the rapid growth of artificial intelligence, data centers, and high-performance computing. Investors closely follow NVIDIA's stock price movements, demand for AI-related hardware, and industry trends to evaluate its growth potential. Because NVIDIA's performance is strongly influenced by emerging technologies and market expectations, its stock is often considered a key indicator of AI-driven market trends and technological expansion.