Guidance: How to Use This Page
This page helps you track and interpret private-company valuation using three simple steps: (1) scan high-level performance metrics, (2) read the funding table chronologically, and (3) compare fund marks for institutional perspective. Review sections in that order to build a structured view of valuation dynamics.
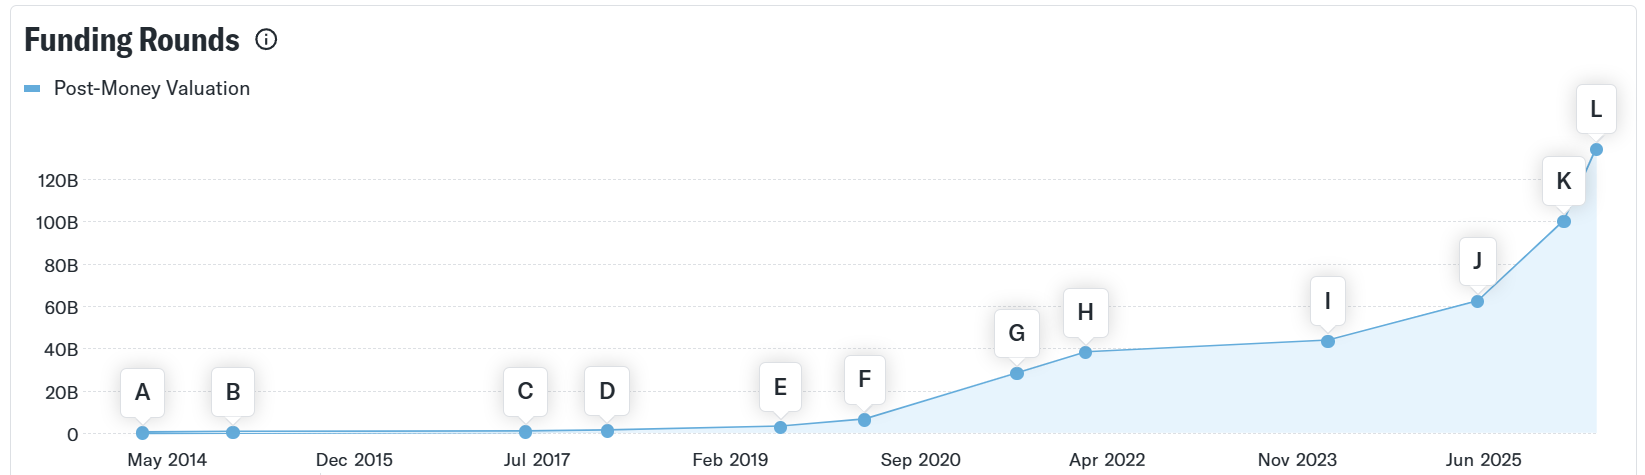
Compare "Amount Raised" and "Post-Money Valuation" across rounds to spot growth shifts. Cross-check those rounds with the Mutual Fund Marks to confirm whether institutional valuations align with funding events.
Performance Overview: DATB.PVT
3M Return
YTD Return
1Y Return
2Y Return
Valuation Information
| Funding Date | Share Class | Amount Raised | Issue Price | Post-Money Valuation |
|---|---|---|---|---|
| 2025-12-16 | Series L | 4B | 190 | 134B |
| 2025-09-08 | Series K | 1.12B | 150 | 100B |
| 2024-12-17 | Series J | 10.17B | 92.5 | 62.04B |
| 2023-09-14 | Series I | 684.56M | 73.5 | 43.41B |
| 2021-08-31 | Series H | 1.63B | 73.4841 | 37.89B |
| 2021-02-01 | Series G | 1.03B | 59.1226 | 28B |
| 2019-10-22 | Series F | 408.01M | 14.3161 | 6.2B |
| 2019-02-05 | Series E | 250M | 7.096 | 2.81B |
| 2017-08-22 | Series D | 140M | 2.7941 | 960.3M |
| 2016-12-15 | Series C | 60.37M | 1.966 | 519.62M |
| 2014-06-30 | Series B | 34.14M | 1.1151 | 250.23M |
| 2013-09-25 | Series A | 14M | 0.2595 | 48.68M |
Mutual Fund Marks
| Reported Date | Fund Name | Fund Ticker | Share Class | Price | Source |
|---|---|---|---|---|---|
| 2025-07-31 | Legg Mason Partners Investment Trust | LCLAX | Series H | 105.8 | See Filing |
| 2025-06-30 | Seasons Series Trust | -- | Series G | 103.51 | See Filing |
| 2025-05-31 | Fidelity Select Portfolios | FSPTX | Series H | 102.8 | See Filing |
| 2025-05-30 | Blackrock Funds | BGSIX | Common | 92.5 | See Filing |
| 2025-04-30 | Legg Mason Partners Investment Trust | LCLAX | Series H | 91.75 | See Filing |
| 2025-03-31 | Blackrock Science And Technology Term Trust | -- | Common | 92.5 | See Filing |
Focused Analysis: Early vs. Late Funding Comparison
Early-Stage Funding Characteristics
Early funding rounds focus on product development and market validation.Capital raised is relatively small, and valuations reflect higher uncertaintyand limited operational scale.
| Round | Date | Amount Raised | Post-Money Valuation |
|---|---|---|---|
| Series A | 2013-09-25 | 14M | 48.68M |
| Series B | 2014-06-30 | 34.14M | 250.23M |
| Series C | 2016-12-15 | 60.37M | 519.62M |
These rounds illustrate how early investors prioritize growth potential over immediate scale, accepting lower valuations in exchange for higher long-term upside.
Late-Stage Funding Characteristics
Late funding rounds signal strong investor confidence and reduced risk. Capital injections increase dramatically, and valuations rise to reflect established market position and revenue scale.
| Round | Date | Amount Raised | Post-Money Valuation |
|---|---|---|---|
| Series G | 2021-02-01 | 1.03B | 28B |
| Series J | 2024-12-17 | 10.17B | 62.04B |
| Series L | 2025-12-16 | 4B | 134B |
Compared to early rounds, late-stage funding emphasizes consolidation, market leadership, and long-term stability, with significantly higher valuation benchmarks.
Select more companies to evaluate +
Open AI

Company B
Company C
Company D
Glossary
- Funding Round
- A stage in which a company raises capital from investors. Each funding round typically represents a different level of company maturity, risk, and valuation. Examples in this page include Series A through Series L.
- Series A / B / C / D / E / F
- Lettered labels used to identify early and mid-stage private investment rounds. Earlier series generally involve smaller capital amounts and higher uncertainty, while later series reflect increased scale and investor confidence.
- Series G / H / I / J / K / L
- Late-stage funding rounds that typically involve large institutional investors. These rounds often correspond to rapid valuation growth and signal that the company has achieved significant market traction.
- Amount Raised
- The total amount of capital collected during a specific funding round. In this dataset, values are expressed in millions (M) or billions (B) of U.S. dollars.
- Issue Price
- The price per share established during a funding round. This value reflects how investors price each share of the company at that stage and is often used as a reference point for valuation comparisons across rounds.
- Post-Money Valuation
- The estimated value of a company immediately after a funding round is completed. It is calculated by adding the amount raised to the company’s pre-money valuation and represents the market’s updated assessment of company worth.
- DATB.PVT
- A private-market ticker-style identifier used in this page to reference Databricks as a privately held company. Unlike public stock tickers, private identifiers are informational and not tradable on public exchanges.
- Mutual Fund Marks
- Valuation estimates reported by mutual funds that hold private company shares. These marks provide insight into how institutional investors internally value private companies over time.
- Fund Ticker
- A short code used to identify a mutual fund. In the Mutual Fund Marks table, tickers such as LCLAX and FSPTX represent specific investment funds reporting valuations.
- Share Class
- A category of shares within a fund or company that may have different rights, pricing, or fee structures. Share classes help distinguish between investment terms.
- Focused Analysis
- A targeted examination of selected portions of the dataset designed to highlight meaningful patterns. In this page, focused analysis compares early-stage and late-stage funding to illustrate how valuation dynamics change over time.